
Background Information about the "Ozone Hole"
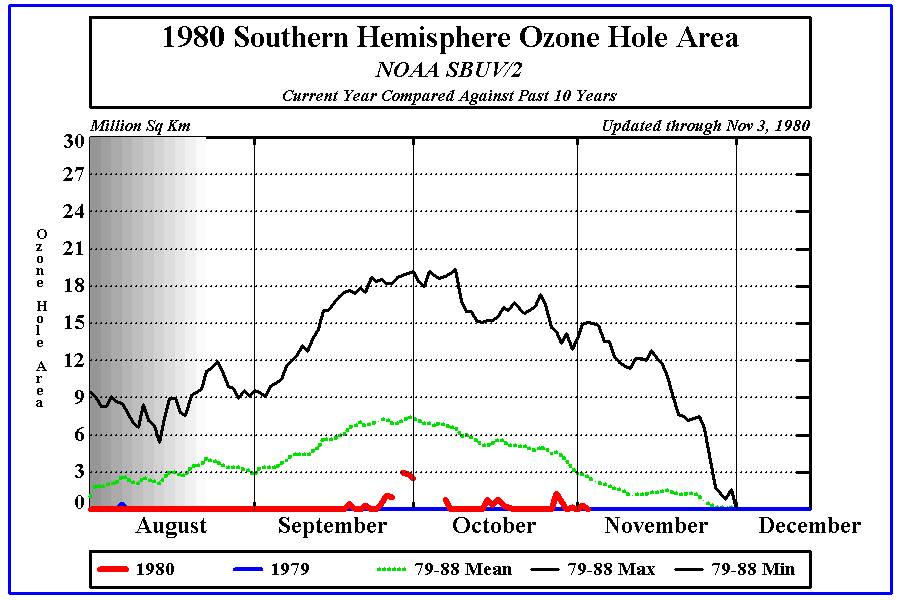
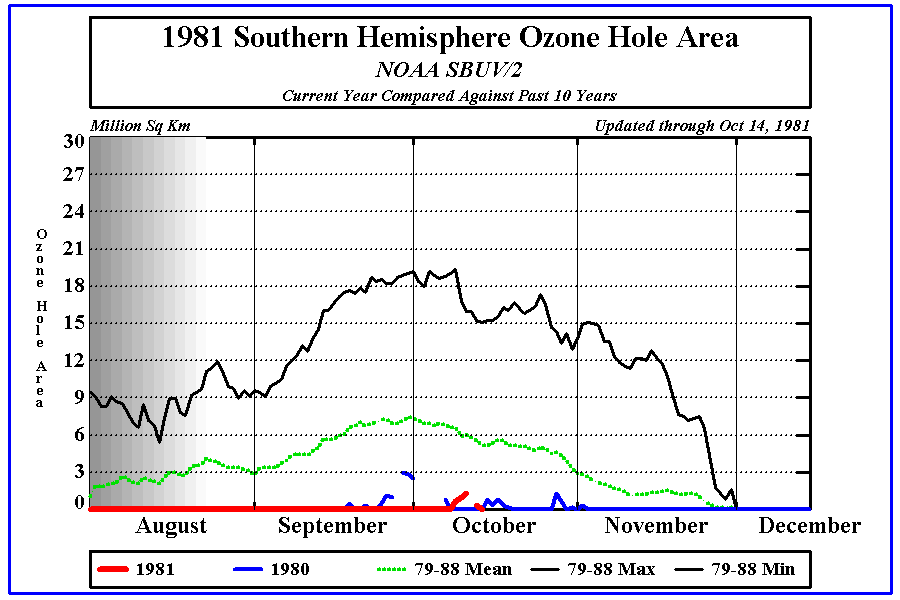
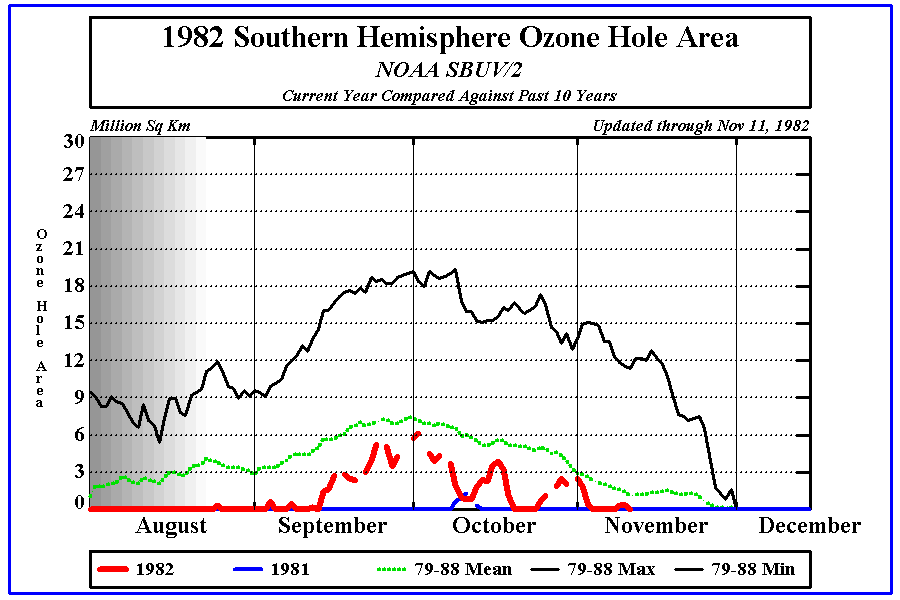
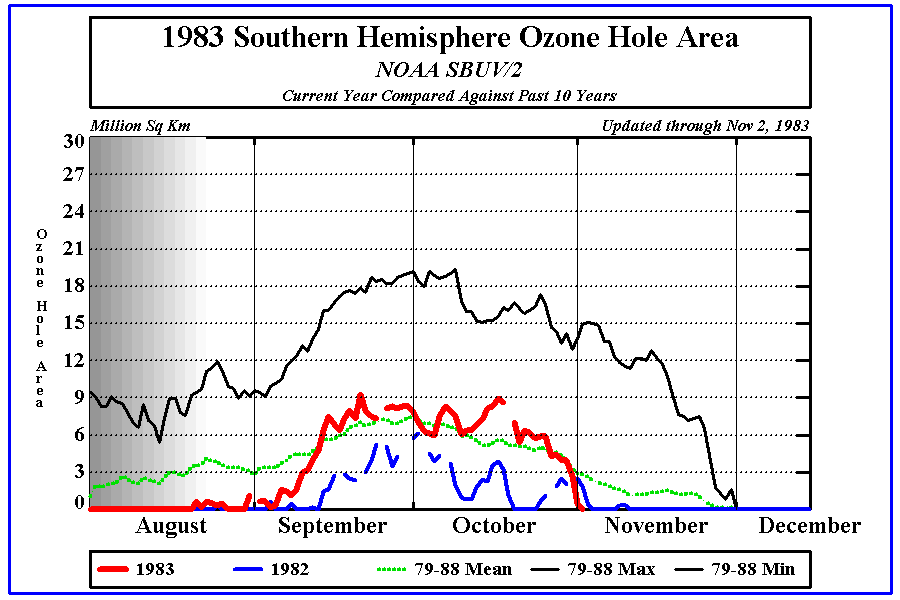
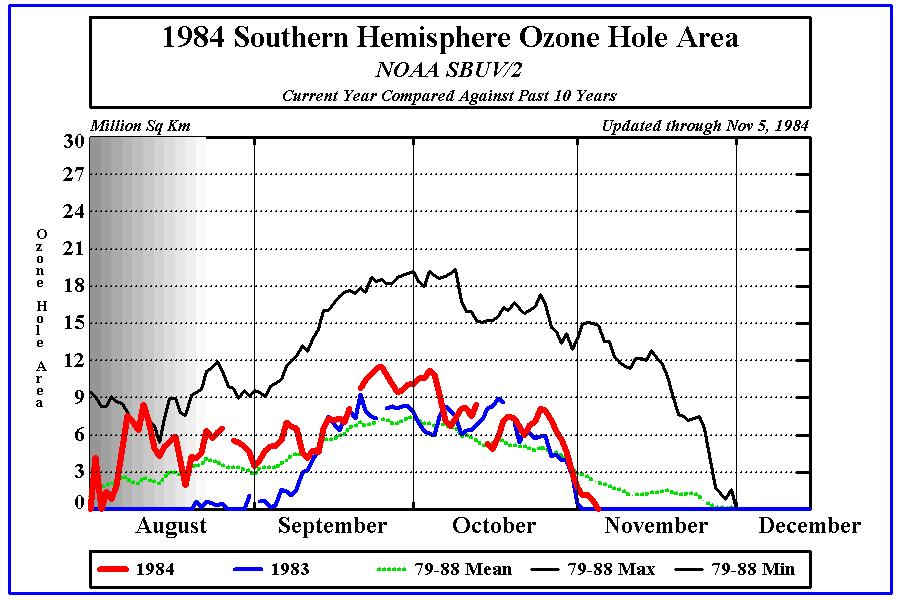
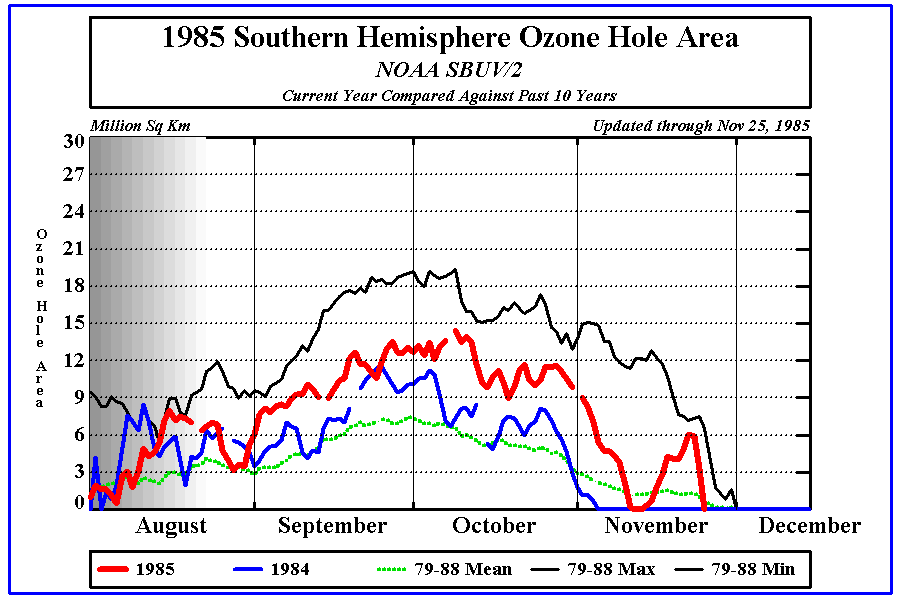
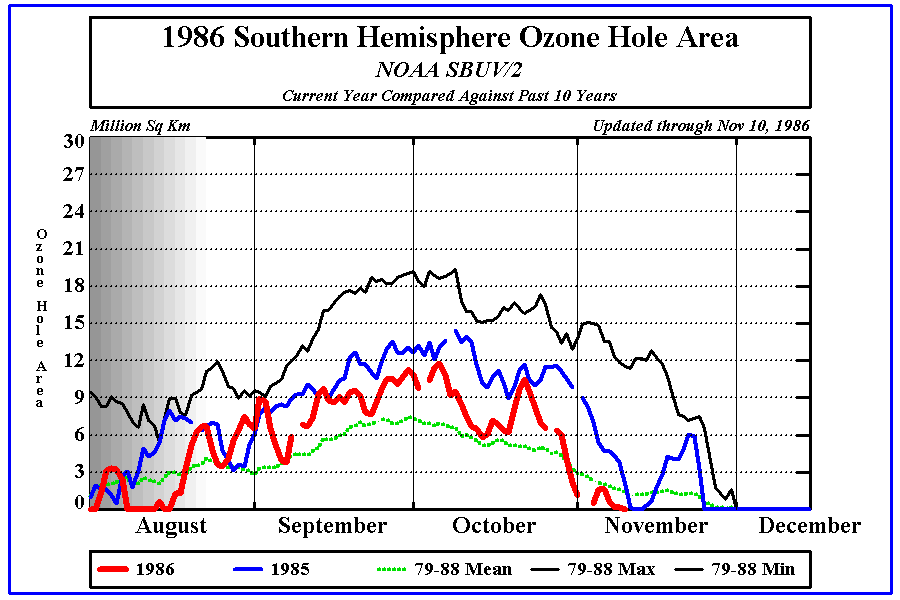
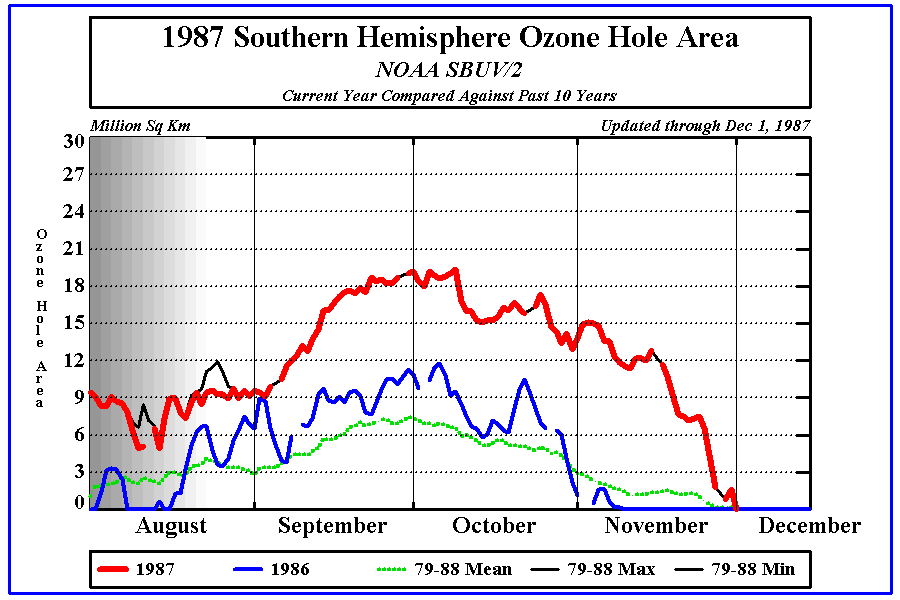
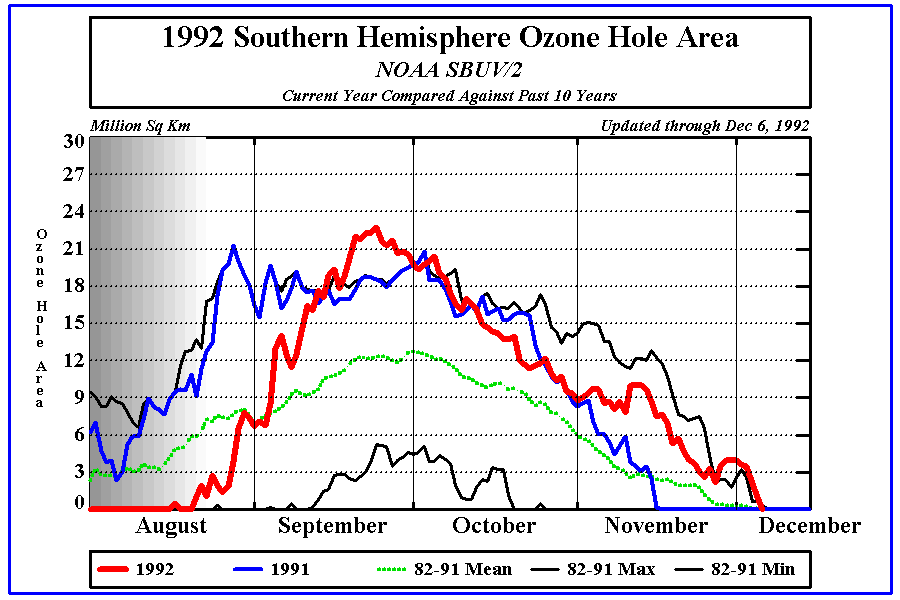
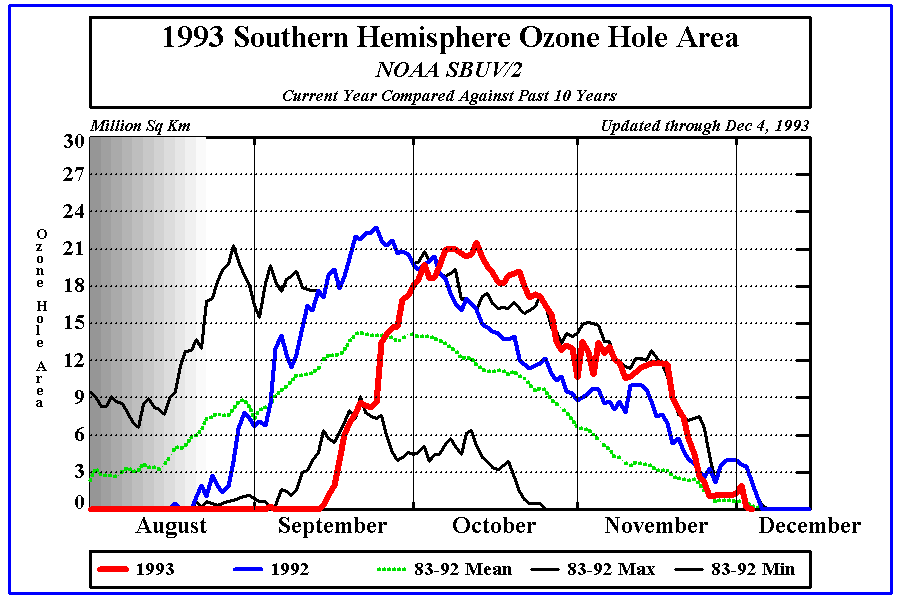
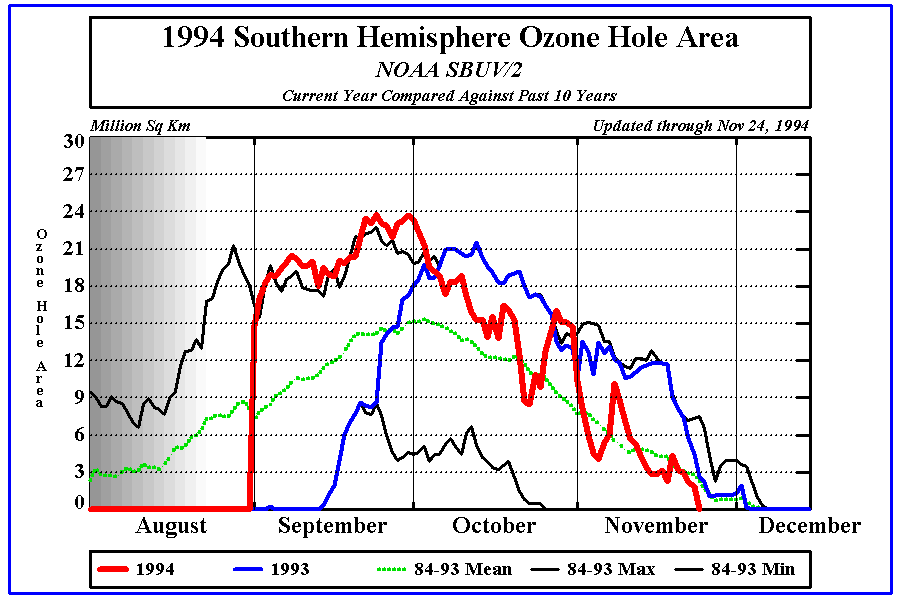
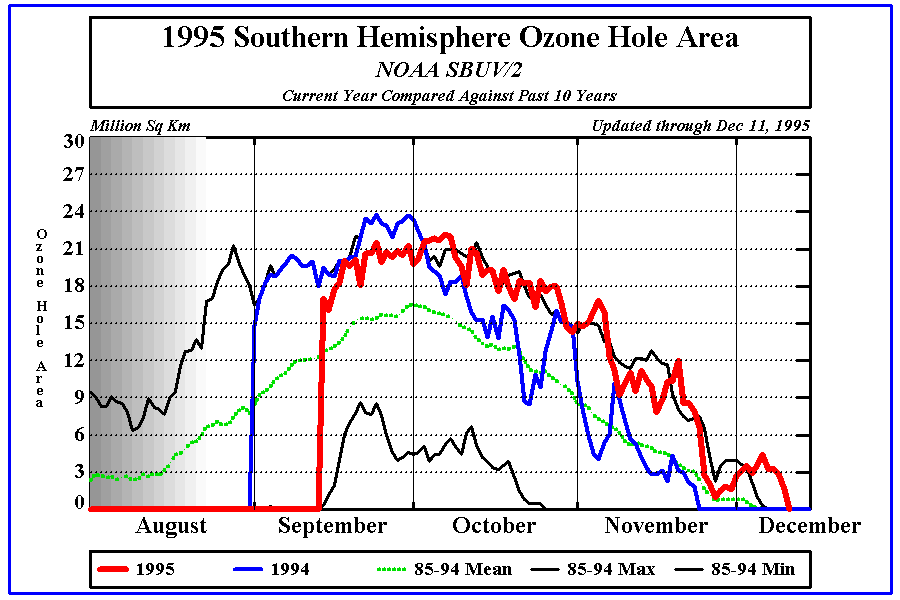
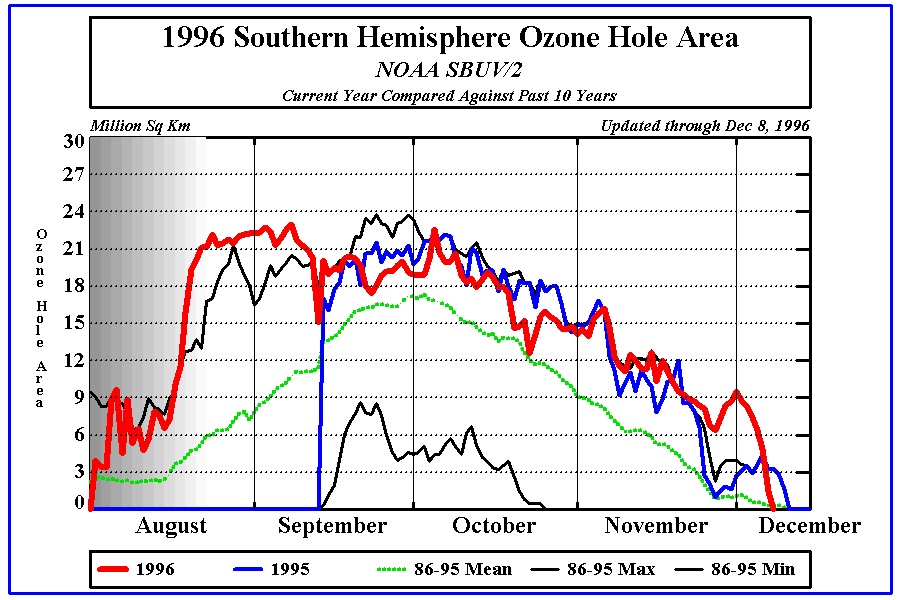
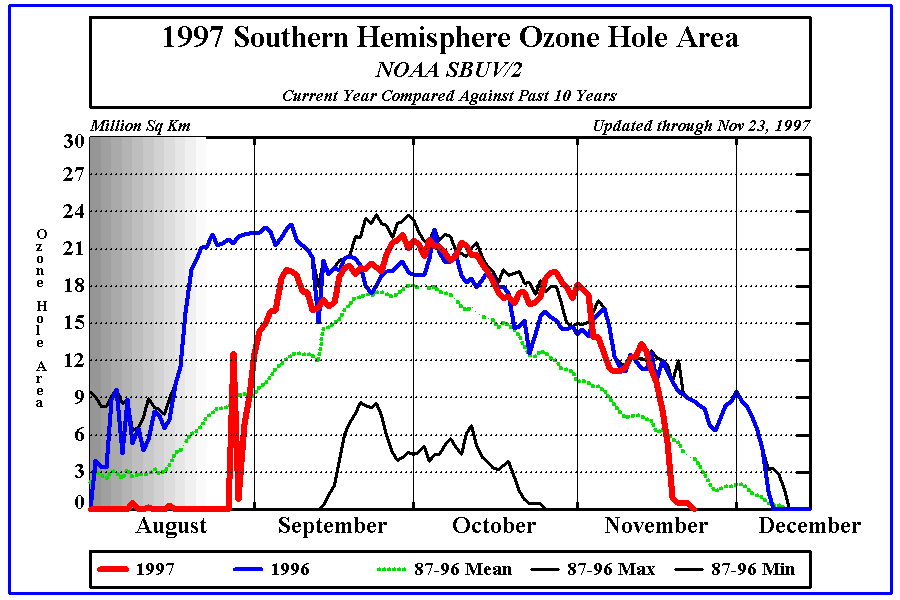
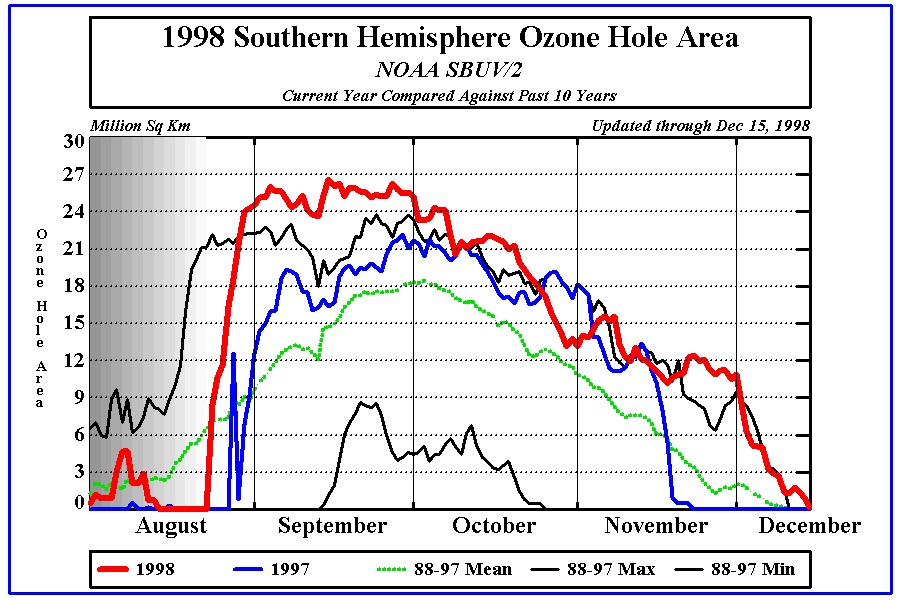
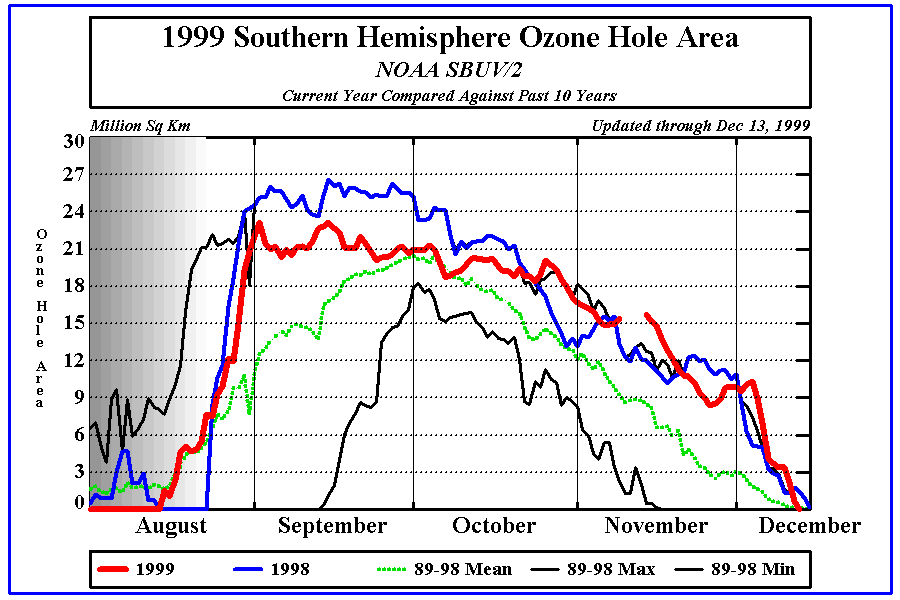
Every year for the past several decades the return of sunlight to the high latitudes of the Southern Hemisphere has produced massive depletion of ozone over Antarctica. Observations in Antarctica initiated in the 1950's document this progressive loss of ozone during the Southern Hemisphere spring. Satellite data from the NASA/TOMS showed that the affected area was not just limited to over the observation stations, but over most of Antarctica. This area of 50-75% depletion of total ozone has been labeled as the "ozone hole". The ozone hole is defined geographicaly as the area wherein the total ozone amount is less than 220 Dobson Units. The ozone hole has steadily grown in size(up to 27 million sq. km.) and length of existence(from August through early December) over the past two decades. This is graphically illustrated in ozone hole area versus Julian day plots for the years: 1979-80, 1981, 1982, 1983, 1984, 1985, 1986, 1987, 1988, 1989, 1990, 1991, 1992, 1993, 1994, 1995, 1996, 1997, 1998, 1999, 2000, 2001, 2002, 2003, 2004, 2005, 2006, 2007.
The cause and effects of the ozone hole are explained in depth by the linked sites. Areas of countries and continents are listed in the table below for reference in comparison to the size of the ozone hole.
NOAA monitors the progression of the ozone hole from space and on the ground in Antarctica. Summaries of previous years' ozone holes are available at the NOAA/CPC Stratospheric Winter Summary site.
What's Happening Currently
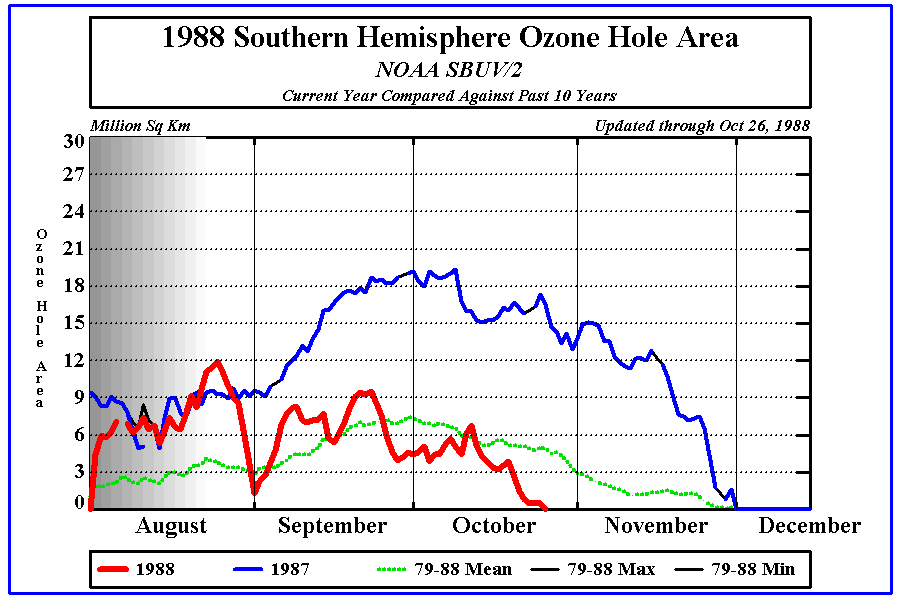
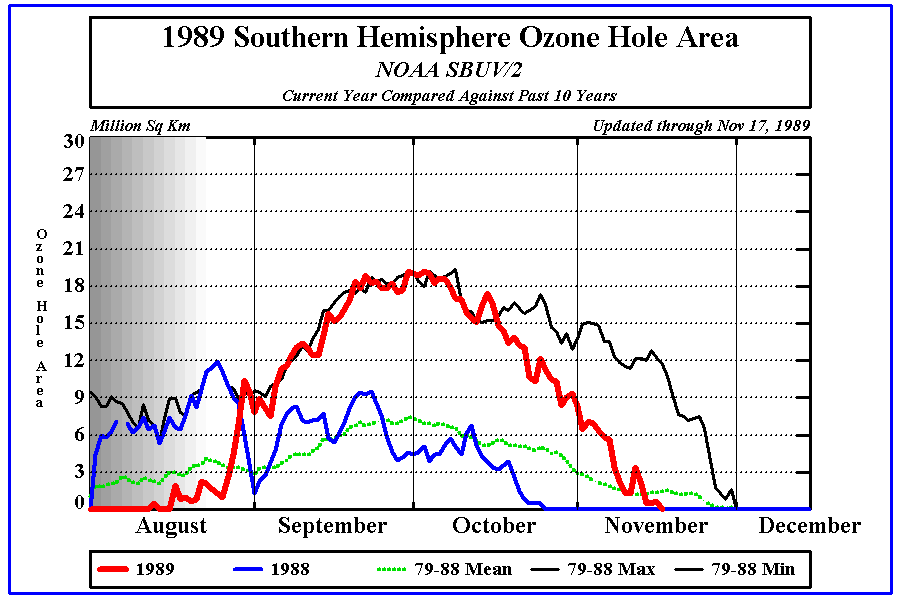
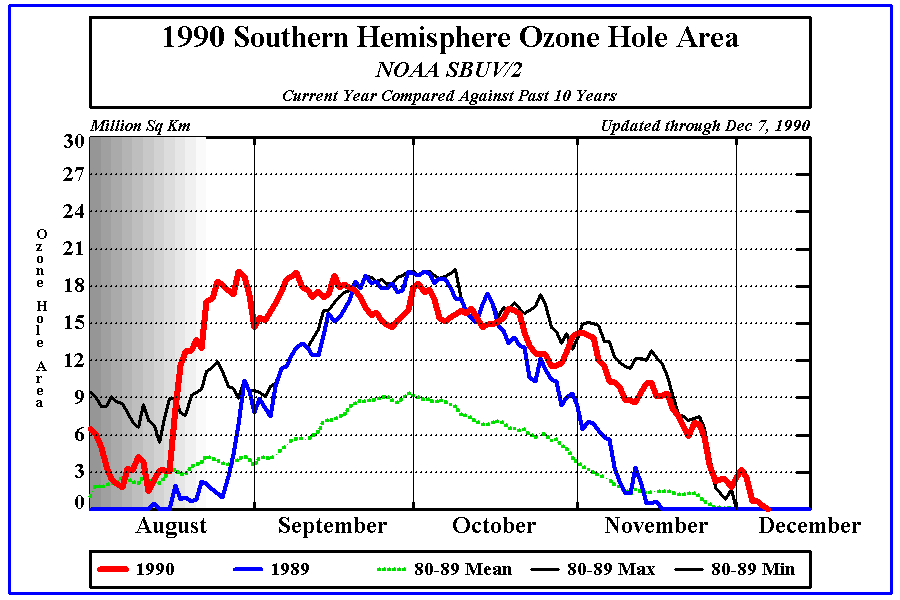
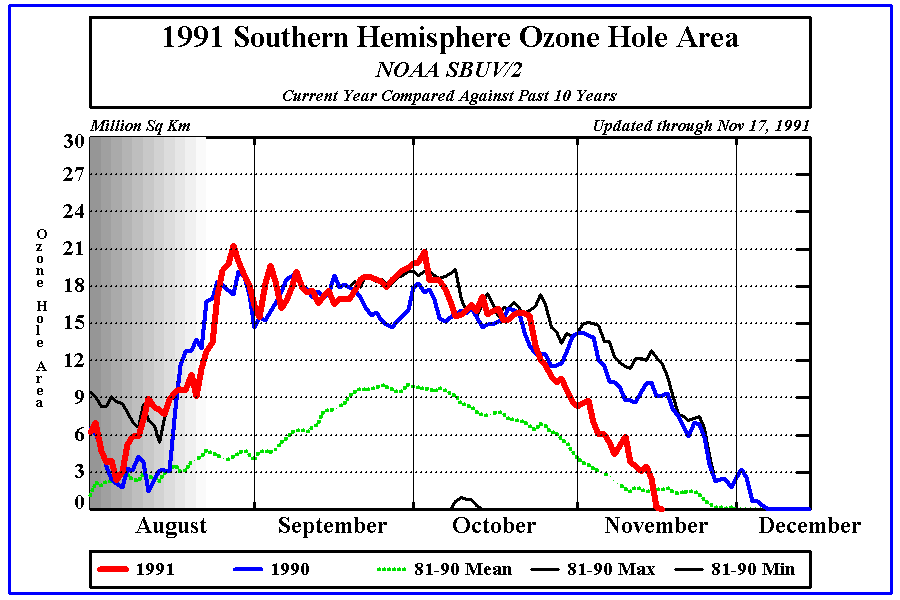
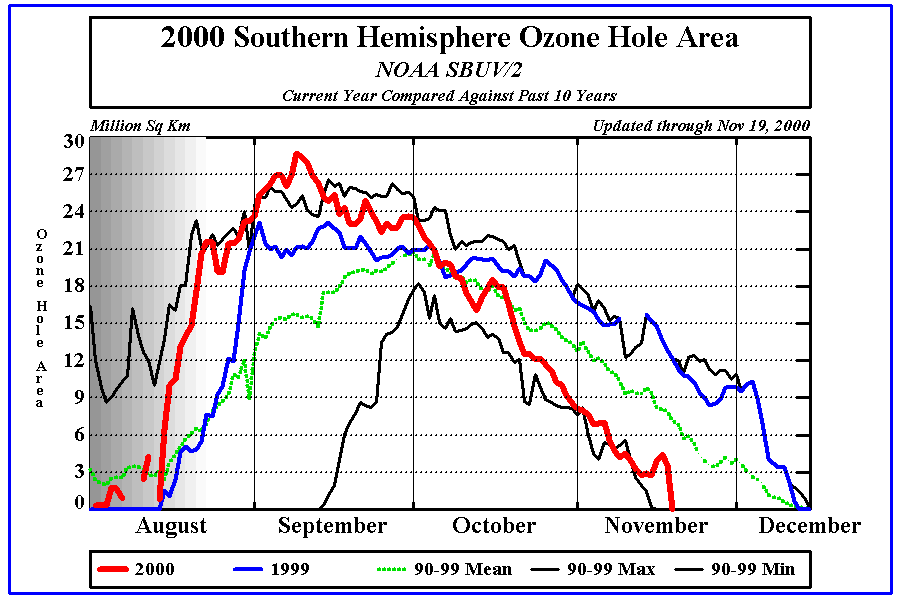
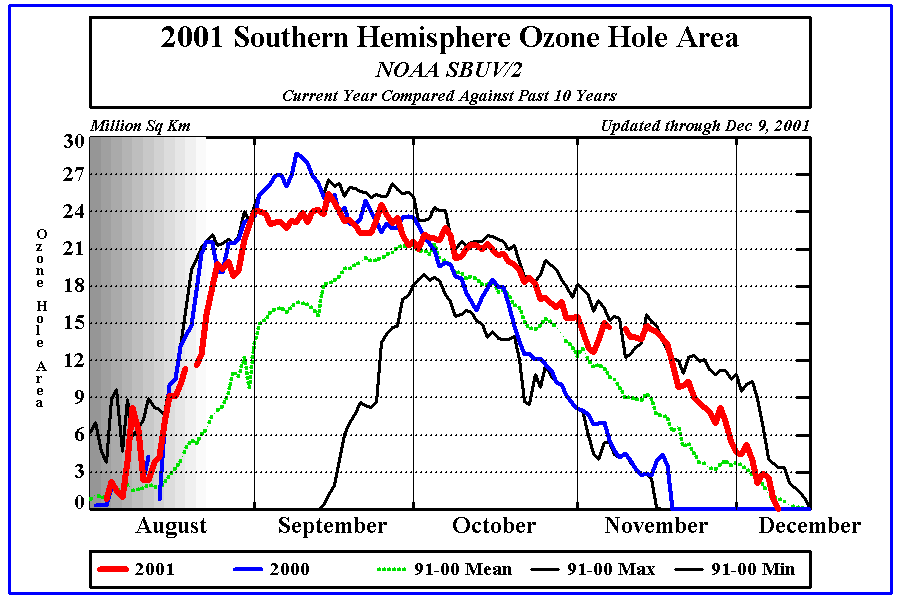
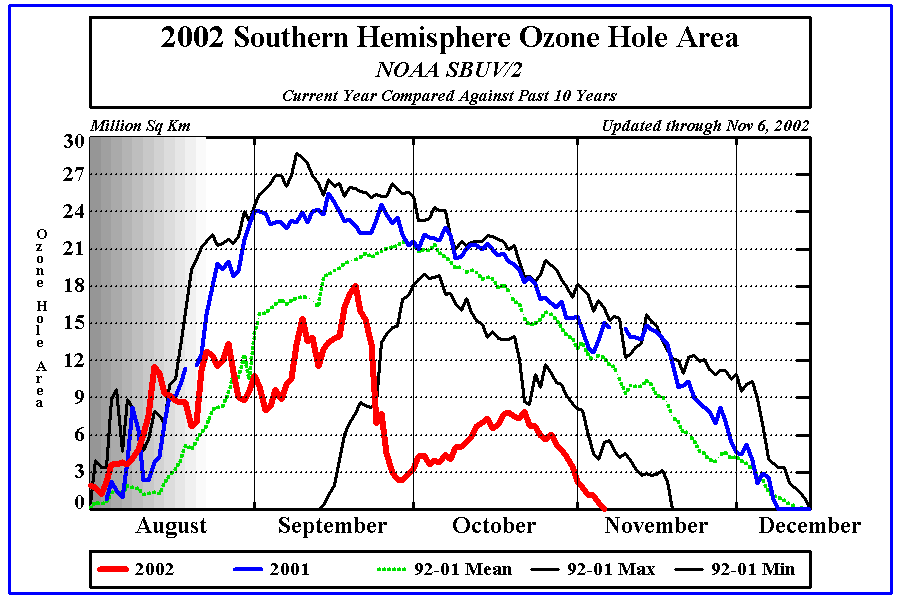
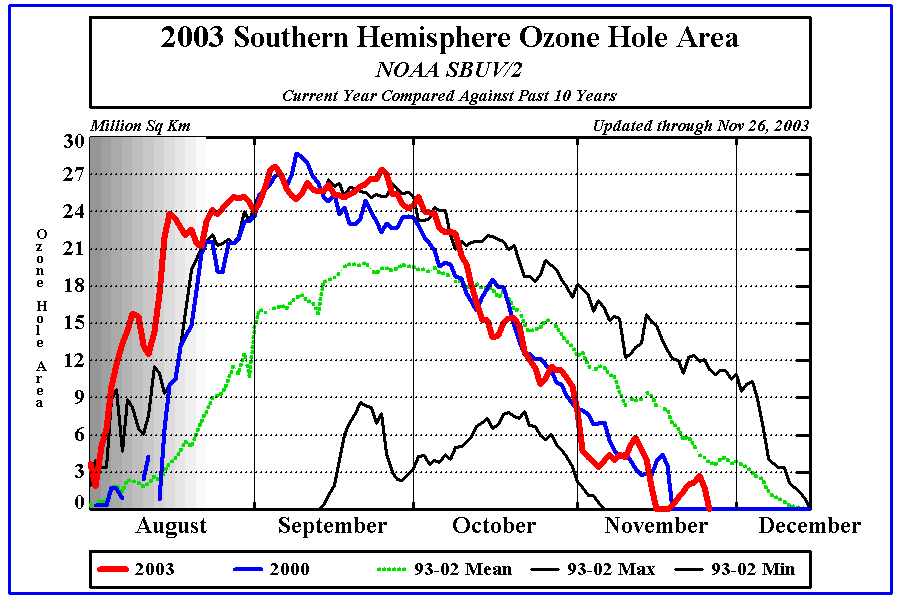
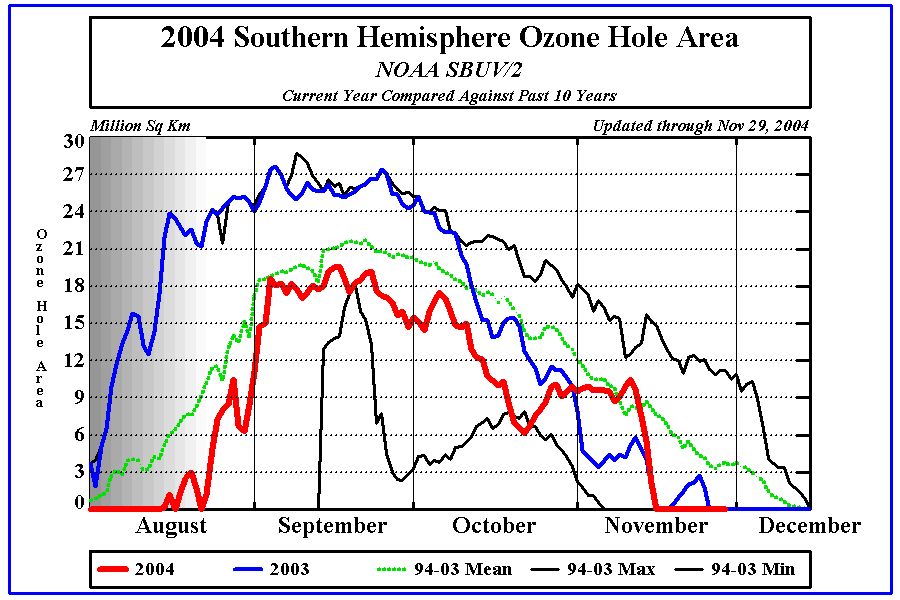
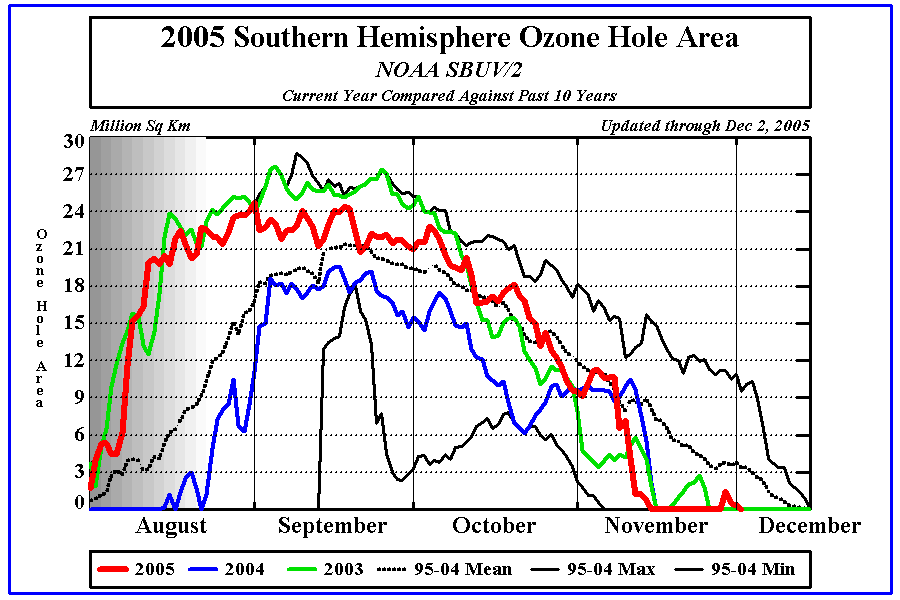
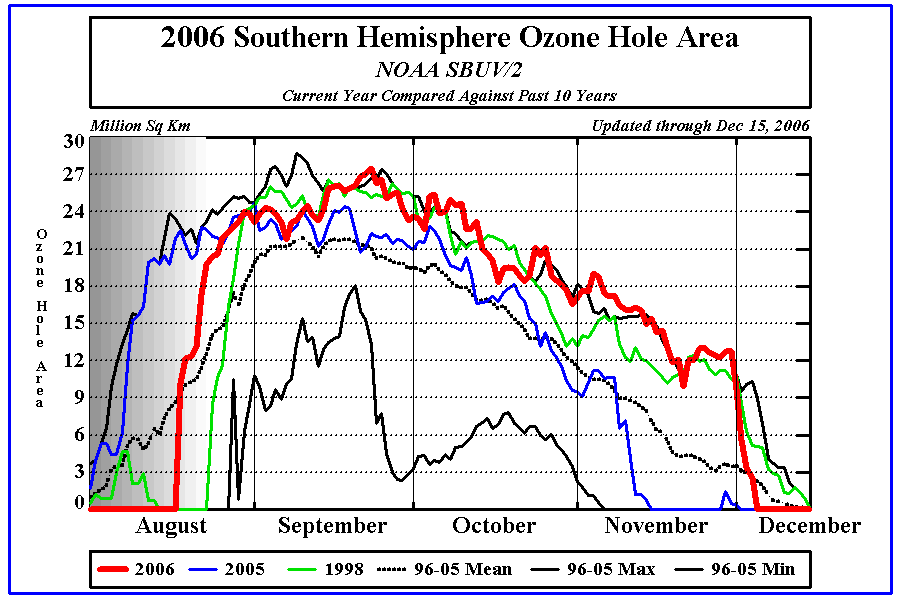
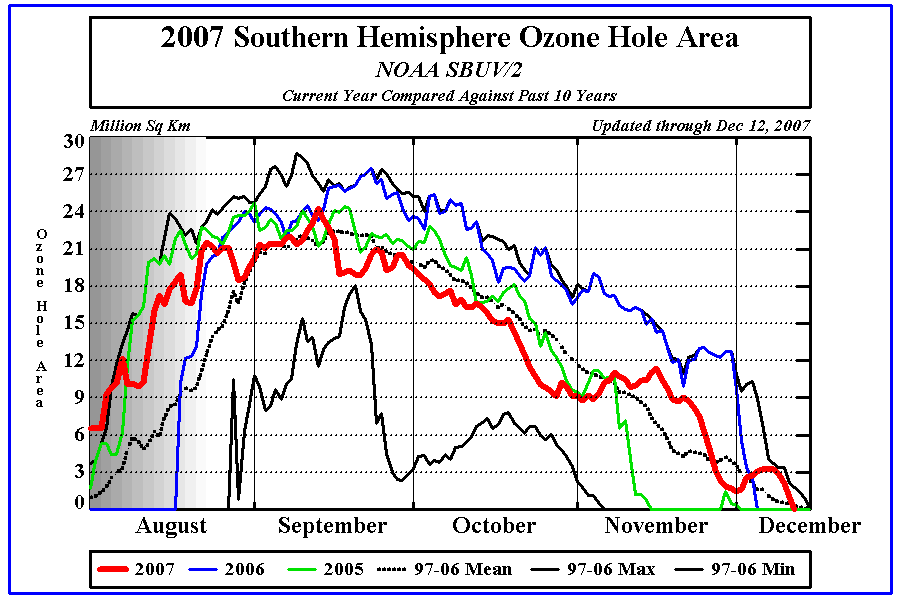
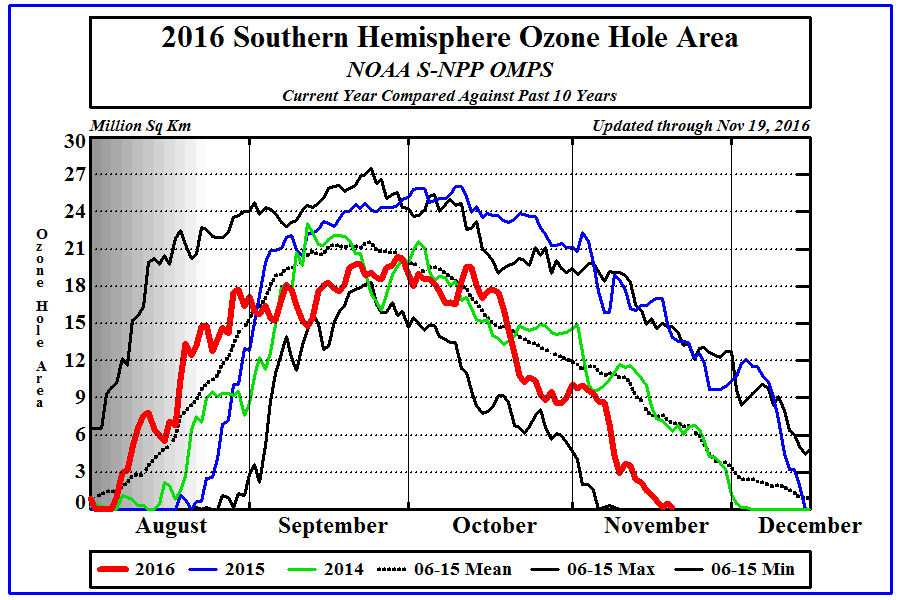
The current year's ozone hole plot shows the progression of this year's ozone hole (red line) and is placed in reference with last year's ozone hole conditions (blue line) and conditions over the previous ten years. The maximum ozone hole area for each day over the ten year period is shown as the upper black line. The minimum ozone hole area for each day of this same period is shown as the lower black line. The mean ozone hole area for each day over this period is shown as the green line. The gray shaded area in August depicts the decreasing degree of uncertainty in the ozone hole size estimate as more of the polar region becomes sunlit. The figure will be updated twice weekly from September through December to show the progress of the current year's ozone hole.
Note that data in August is not as reliable as succeeding months due to limited observation coverage by the ozone monitoring instrument.
The area ploted is in Million Square Kilometers.
What is your opinion?
Blogroll Me!


